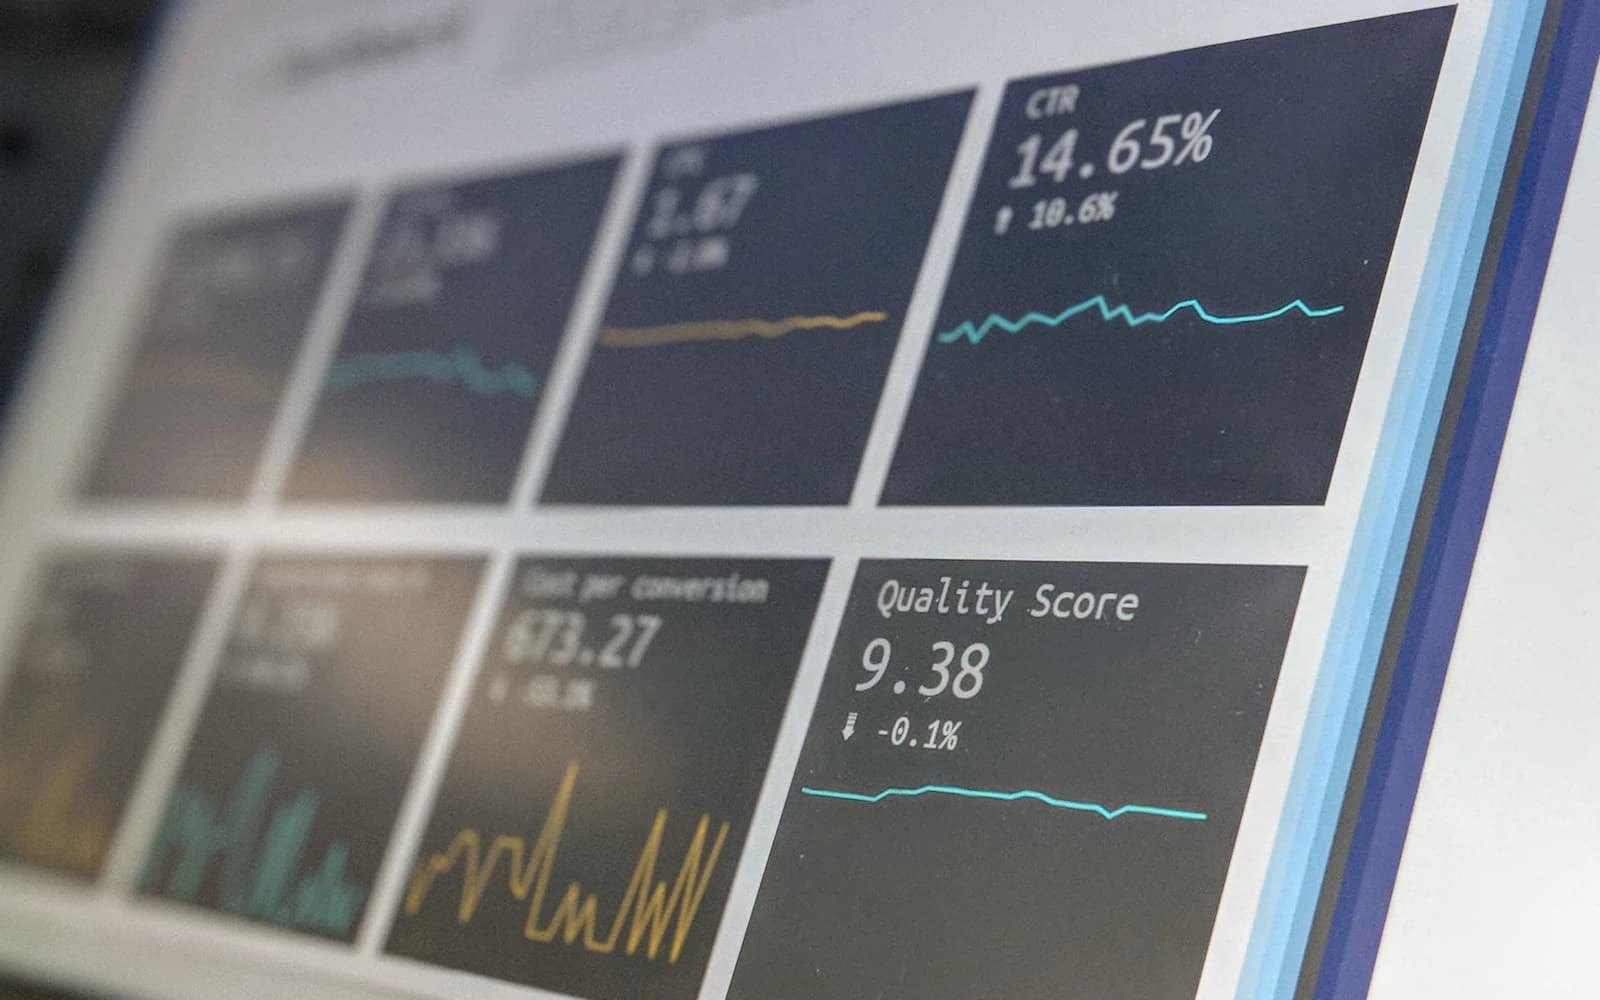
A good Lighthouse score describes one controlled test. Your visitors use different devices, networks, pages and account states. Diagnose the journeys they actually complete, using real-user measurements alongside browser traces, before deciding whether images, JavaScript, the server or an external service needs attention.
A homepage can feel instant on an engineer’s laptop while a customer waits for a search result, an account page or a booking confirmation. Both experiences can be real. The mistake is treating a test of the homepage as evidence about every journey through the product.
This guide is for teams with a working website, portal or application that still attracts complaints about speed. The objective is to turn “it feels slow” into a reproducible diagnosis and a small, testable improvement plan.
- Separate a page loading slowly from a button responding slowly or a transaction completing slowly.
- Group measurements by journey, device and release instead of relying on a site-wide average.
- Verify that a fix improves real task completion without introducing errors.
What does a speed score actually tell you?
Lighthouse runs a controlled assessment that helps reveal opportunities in the page it tests. Field measurements describe visits made by real people. The two answer different questions: a lab test helps reproduce a technical problem; field data helps establish how broadly people encounter it. Google’s measurement guidance explicitly describes reasons those results can differ.
Core Web Vitals cover loading, responsiveness and visual stability. Largest Contentful Paint (LCP) measures when the largest visible content element is rendered; a good result is 2.5 seconds or less. Interaction to Next Paint (INP) measures how long an interaction waits for the next visual update; a good result is 200 milliseconds or less. Cumulative Layout Shift (CLS) measures unexpected layout movement; a good score is 0.1 or less. These industry thresholds are assessed at the 75th percentile of visits, not as an average. They are not SystemVale performance results, and they do not measure every important business action.
A booking might meet these thresholds while its availability lookup takes too long. Keep a separate measurement for the customer’s actual outcome, such as time from selecting a date to seeing available appointments.
Which customer journeys should you measure first?
Start with three tasks that matter to the business: finding the right item, submitting a qualified enquiry, or completing an authenticated workflow. Write the start and finish of each task. A route name alone is insufficient if the delay happens after someone clicks a button.
For each journey, capture device class, page type, authenticated state, release version and the operation that was slow. Use broad categories rather than personal identifiers. Do not put names, email addresses, search text or access tokens into performance telemetry.
Prioritise repeated delays that prevent a valuable task from completing. A lightly visited administrative screen may still matter if it blocks every support agent. Traffic is one input; task importance, severity and the cost of recovery belong beside it.
- Loading: when can the person see enough to begin?
- Interaction: does a click or keystroke produce timely feedback?
- Completion: when does the requested result actually arrive?
- Recovery: what happens when the request fails or times out?
How do you find the cause of a slow visit?
Reproduce the same journey on an ordinary phone and a constrained connection. Start from a fresh visit, then repeat with a warm cache. Test both signed-out and signed-in states where relevant. Record the environment so another engineer can reproduce the observation.
Use the browser’s network and performance tools to trace the delay. Check whether the browser is waiting for a response, downloading too much, or spending time processing JavaScript. For a slow server response, follow the request into application and database traces. A frontend change cannot eliminate a database query that dominates the wait.
Change one suspected cause at a time. Temporarily disabling a third-party widget in a test environment can reveal its contribution, but the final decision must consider the function that widget provides.
| Observed symptom | First investigation | A misleading shortcut |
|---|---|---|
| Main content arrives late | Response timing, critical image and render dependencies | Compressing every asset without checking the critical path |
| Typing or clicking feels delayed | Long JavaScript tasks and expensive rendering | Adding a loading spinner to every control |
| Search waits after the page loads | Search API, database work and request sequence | Celebrating a faster homepage |
| Layout jumps during reading | Missing dimensions and late inserted content | Hiding the movement with an animation |
What would a useful investigation look like?
Consider an illustrative appointment portal. The landing page performs well, but customers report that changing the appointment date feels slow. A trace shows the interface requesting the profile, then the office list, then availability, even though availability does not depend on the first two responses.
The proposed fix is to remove unnecessary sequential requests and cache information that is safe to reuse. The team also provides clear progress feedback and preserves the selected date when the availability service fails. This addresses both waiting time and recovery.
That is a hypothetical diagnostic example, not a client result. The useful lesson is the sequence: identify the exact task, trace its dependencies, change the bottleneck and verify the entire interaction. A redesign or a new hosting plan would have been premature.
How should you choose and release the fix?
Write a short hypothesis before implementation: “The availability lookup waits for unrelated requests; running those requests independently should shorten the wait without increasing failed bookings.” Attach the trace and specify the checks that would disprove the hypothesis.
Give each proposed fix an owner, an expected effect and a rollback condition. For caching changes, include correctness and freshness checks. For smaller bundles, test the features that were deferred. For infrastructure changes, compare errors and saturation alongside response time.
Release to a limited audience when the system supports it. Compare similar devices and traffic periods, and annotate the release. A simple before-and-after comparison can be distorted by a campaign, an outage or a quieter day; it is evidence to interpret, not automatic proof of causation.
How do you stop the same problem returning?
Create a small performance budget for each important journey. A budget is an agreed limit for something the team can monitor, such as initial JavaScript, an API response time or the completion time of a representative flow. Set it from a measured baseline and customer needs rather than borrowing an arbitrary number.
Run repeatable checks during development, but keep field monitoring after release. Assign someone to investigate regressions; an alert without an owner becomes background noise. Review error rates, failed tasks and support complaints together with speed.
If you do not have enough field data, say so. Use controlled tests and observed customer sessions while building a privacy-conscious measurement baseline. Do not report a tiny sample as a reliable picture of all visitors.
Your next steps.
Choose one important journey and write its start and finish.
Record a slow attempt with its device, account state and release.
Trace the dominant wait, implement one change and compare the complete task.
A little more clarity.
Is a Lighthouse score of 100 necessary?
No. It is a useful diagnostic score, not a guarantee of a good customer journey. Focus on meaningful field measurements, accessibility and successful task completion, then use lab tests to investigate specific problems.
Should I upgrade hosting before optimising the website?
Only when measurements point to a hosting or capacity constraint. Large assets, unnecessary JavaScript, sequential API calls and inefficient queries require different fixes. An upgrade may hide a problem temporarily without removing it.
How quickly can I know whether a change helped?
Repeatable lab tests can show an immediate technical difference. Confidence about real visits depends on traffic volume, the reporting window and comparable conditions. Decide the observation period before release rather than declaring success after a single run.
Check the sources.
Primary references for the technical guidance above. Checked 12 October 2026.
Written by SystemVale
Practical guidance on software, AI and automation across our five core practices.
Explore Performance & Cost →